Human nervous system 3D medical illustration

Why do people
experience pain differently?

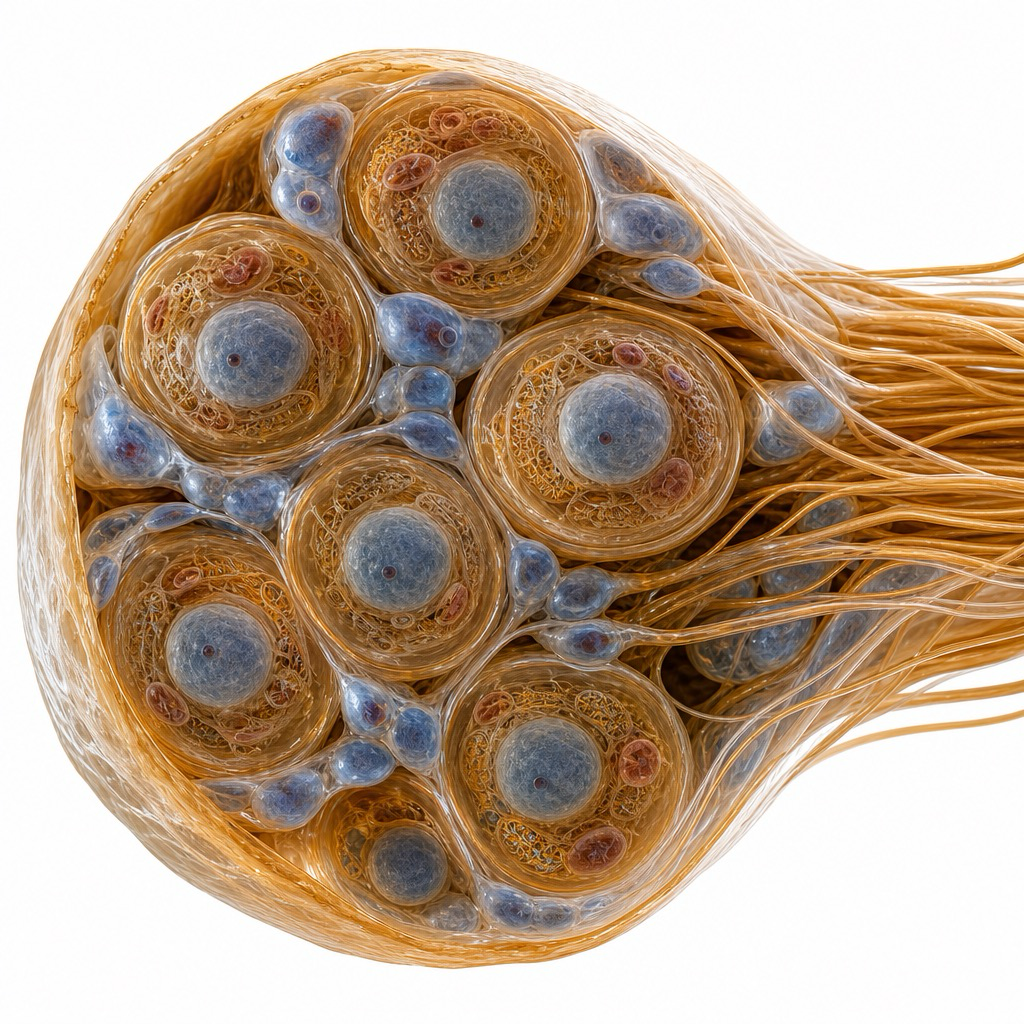
NociAtlas explores the single-cell transcriptomic landscape of pain — mapping gene expression across dorsal root ganglion neuron subtypes to uncover the cellular basis of pain sensitivity.

990
Single Cells
10
Cell Types
18
Pain Genes
3
Nociceptor Classes

Cell Atlas

Interactive UMAP visualization of 990 DRG neurons. Click any cluster to explore its identity and pain relevance.

Gene Explorer

Search any pain-related gene and see its expression profile across all 10 neuron subtypes with mechanistic annotations.

Pain vs Control

Differential expression analysis reveals which genes are upregulated in chronic pain states across neuron subtypes.
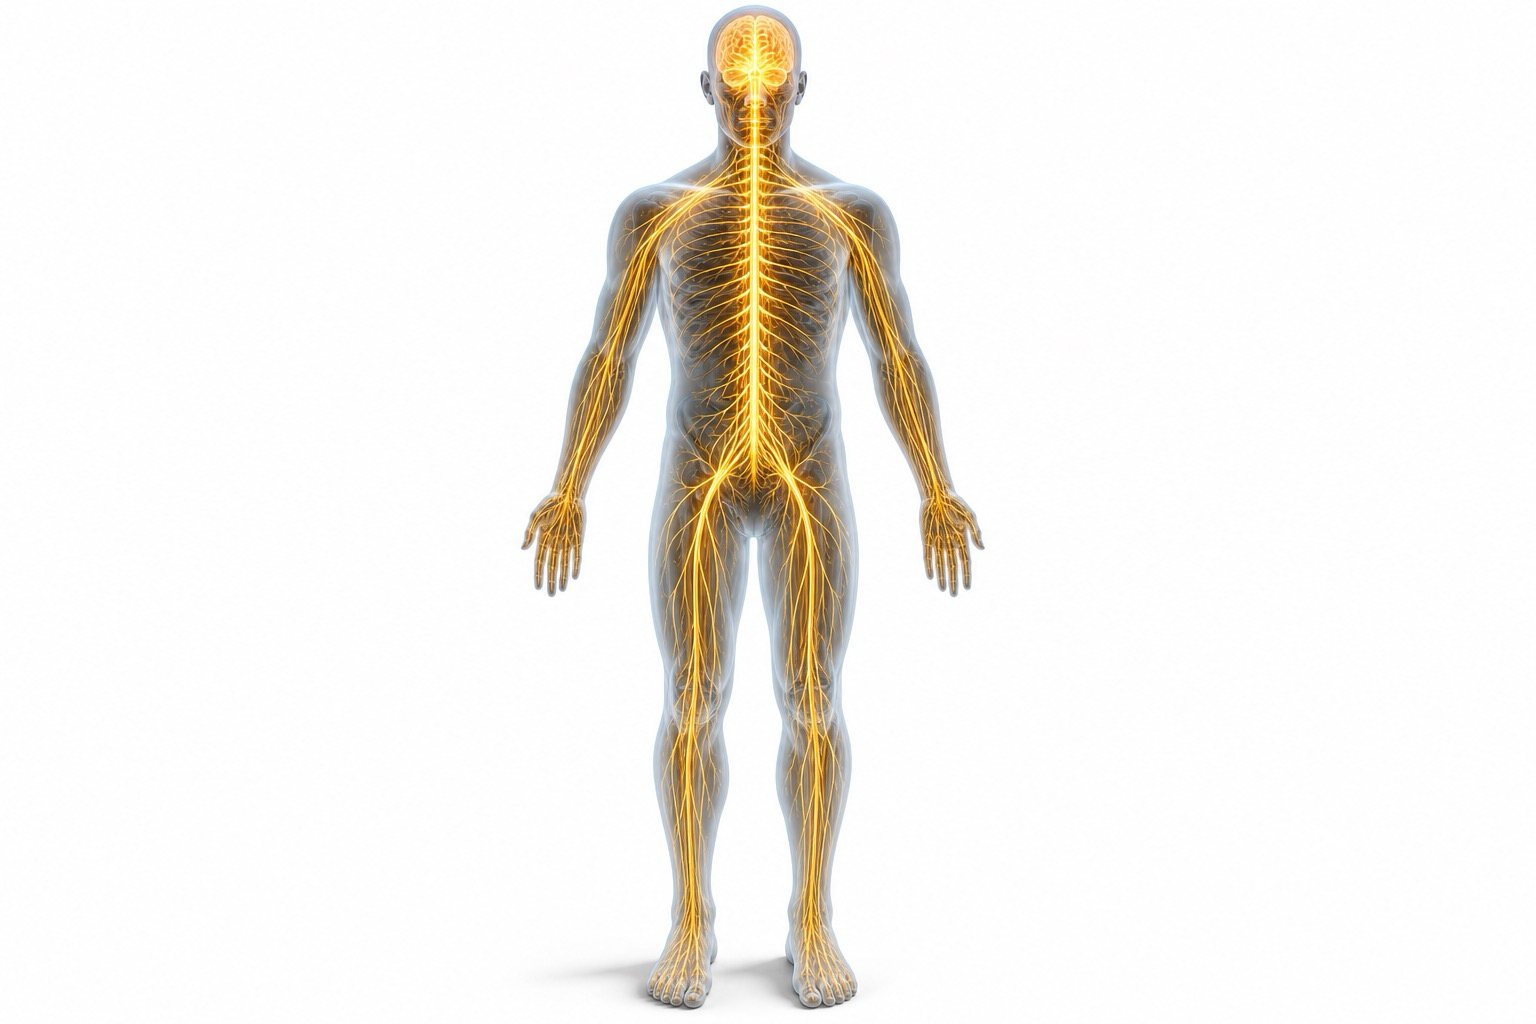
Pain Explorer

Enter a pain location or condition — see which genes and cell types are involved, with an anatomical body map highlighting the affected region.

Cell Atlas

UMAP projection of 990 dorsal root ganglion cells — click a cluster to view cell type details

UMAP 1 (X axis)

Represents the largest source of variation in gene expression across all cells. Cells with similar transcriptomic profiles cluster together along this axis. No direct biological meaning — position only reflects relative similarity.

UMAP 2 (Y axis)

Captures the second largest source of variation, orthogonal to UMAP 1. Together, UMAP 1 and 2 compress 18-dimensional gene expression data into 2D space — preserving local neighborhood structure so that clusters reflect real biological cell-type differences.

How to read this plot: Distance between clusters matters — nearby clusters share more genes. Distance within a cluster reflects cell-to-cell variability. The absolute coordinates (e.g. UMAP1 = 5.2) carry no meaning; only relative positions do.

← Click a cell cluster

Select any point on the UMAP to view cell type information, marker genes, and pain relevance.

Gene Explorer

Search a pain-related gene to view its expression across DRG cell types

Action Sites in the Body

Highlighted Regions

Select a gene above to see its action sites.

Pain Site Explorer

Enter a pain location or condition to explore the underlying genes and cell types

Menstrual Pain Migraine Lower Back Pain Neuropathic Pain Inflammatory Pain Knee Pain Headache Fibromyalgia

About NociAtlas

Data sources, methods, and scientific rationale

Project Overview

NociAtlas is an interactive single-cell transcriptomic atlas exploring the cellular and molecular basis of pain. The platform maps gene expression across dorsal root ganglion (DRG) neuron subtypes to identify which cell populations and genetic programs underlie differences in pain sensitivity.

The central question: Why do people experience pain so differently? Emerging evidence from single-cell transcriptomics suggests that the answer lies in the molecular heterogeneity of sensory neuron subtypes — and how inflammation, injury, or genetic variation shifts gene expression within those subtypes.

Research Question

"Which dorsal root ganglion cell types and pain-associated genes show the greatest transcriptional changes in chronic pain states, and how do their expression patterns relate to known neurobiological mechanisms?"

This platform integrates cell-type identity, gene expression, anatomical localization, and differential expression to provide a mechanistic view of pain at single-cell resolution.

Data & Methods

DRG neurons

Cell Atlas

Single-cell RNA-seq data from mouse and human DRG neurons. Cell type annotations based on Usoskin et al. (2015) and Zeisel et al. (2018) classification systems. UMAP dimensionality reduction via UMAP-learn; Leiden clustering for unsupervised cell grouping.

Gene Expression

Expression values are log-normalized counts averaged per cell type. Gene panels were curated from pain neuroscience literature, prioritizing genes with established roles in nociception, neuroinflammation, and synaptic plasticity.

Differential Expression

Pain vs. Control comparison uses log2 fold change (log2FC) and adjusted p-values. Positive log2FC indicates upregulation in chronic pain; negative indicates downregulation. Significance threshold: p < 0.05.

Key References

Usoskin et al. (2015)Unbiased classification of sensory neuron types by large-scale single-cell RNA sequencing. Nature Neuroscience, 18, 145–153.
Zeisel et al. (2018)Molecular Architecture of the Mouse Nervous System. Cell, 174(4), 999–1014.
Woolf & Salter (2000)Neuronal Plasticity: Increasing the Gain in Pain. Science, 288(5472), 1765–1769.
Basbaum et al. (2009)Cellular and Molecular Mechanisms of Pain. Cell, 139(2), 267–284.
Julius & Bhattacharyya (2013)TRP channels and pain. Annual Review of Cell and Developmental Biology, 29, 355–384.

Cell Type Classification

DRG neurons are classified into three major classes based on myelination, function, and molecular markers:

NF neurons — Large myelinated Aβ/Aδ fibers. Low pain threshold. Markers: NEFH, NECAB2, PVALB.
PEP neurons — Peptidergic unmyelinated C-fibers. Release CGRP + substance P. Markers: TRPV1, CALCA, TAC1.
NP neurons — Non-peptidergic C-fibers. Bind GDNF. Markers: MRGPRD, NPPB, IL6.
Satellite Glia — Glial support cells. Modulate nociceptor excitability. Markers: FABP7, KCNJ10.

Limitations & Disclaimer

⚠️ Gene expression values shown are illustrative, derived from published DRG single-cell datasets and curated literature. They are intended for educational and exploratory purposes, not for clinical interpretation.

⚠️ The Pain vs Control differential expression reflects patterns observed in chronic pain animal models. Human chronic pain transcriptomics may differ.

⚠️ Body map annotations represent the primary anatomical sites of gene action based on current literature and may not capture all expression contexts.

⚠️ This platform is an independent academic project and is not affiliated with any clinical institution.

Pain vs Control

Differential gene expression between chronic pain and control conditions in peptidergic nociceptors

Top Differentially Expressed Genes